Quickly Making an R Shiny Bingo App

During the lockdown of the city, game nights are happening on Zoom a lot. I was asked if I could code up a bingo game—about an hour and a half before game time. I’m sure there’s probably some type of bingo game programmed in Shiny already, but I wanted to see what I could do under crunch from scratch. Here’s what I’ve got.

Using the rules from Wikipedia, I made two apps: One for the bingo master (who shares their screen) and one for each person playing bingo. All code is below and at my GitHub.

The bingo master app is for drawing a new letter-number combination, keeping a record of what has been called, and then starting a new game when necessary.

The bingo player app is a grid of checkboxes that someone can check whenever that letter-number combination has been called. At a previous job, I remember getting creative with using tagList and lapply statements, which would be handy for generating a grid of checkboxes in less code, but I can’t remember how to do that at the moment, so you’ll see some copy-pasted stanza code in the player script. I know this would offend my statistical programming professor from grad school, but ¯\_(ツ)_/¯

Bingo Master

library(shiny)
library(dplyr)

ui <- fluidPage(
    sidebarLayout(
        sidebarPanel(
            actionButton("draw", "Draw"),
            br(),
            br(),
            actionButton("new_game", "New Game"),
            
        ),
        mainPanel(
            uiOutput("display")
        )
    )
)

server <- function(input, output) {
    v <- reactiveValues(
        current = NULL, 
        previous = NULL,
        counter = 0,
        master = list(
            b = paste0("B-", sample(1:15)),
            i = paste0("I-", sample(16:30)),
            n = paste0("N-", sample(31:45)),
            g = paste0("G-", sample(46:60)),
            o = paste0("O-", sample(61:75))
        ) %>% 
            unlist() %>% 
            `[`(sample(1:75))
    )
    
    observeEvent(input$new_game, {
        v$current <- NULL
        v$previous <- NULL
        v$counter <- 0
    })
    
    observeEvent(input$draw, {
        
        if (v$counter > 74) {
            NULL
        } else {
            v$counter <- v$counter + 1
            v$current <- v$master[v$counter]
            v$previous <- c(v$current, v$previous)
        }
    })
    
    output$display <- renderUI({
        tagList(
            p(v$current, style = "font-size:50px"),
            br(),
            p(paste(v$previous, collapse = ", "))
        )
    })
}

shinyApp(ui = ui, server = server)

Bingo Player

library(shiny)

make_card <- function() {
    out <- data.frame(
        B = sample(1:15,  5),
        I = sample(16:30, 5),
        N = sample(31:45, 5),
        G = sample(46:60, 5),
        O = sample(61:75, 5)
    )
    
    out$N[3] <- NA
    
    return(out)
}

ui <- fluidPage(
    sidebarLayout(
        sidebarPanel(
            actionButton("card", "Make a New Card")
        ),
        mainPanel(
            column(2, uiOutput("b")),
            column(2, uiOutput("i")),
            column(2, uiOutput("n")),
            column(2, uiOutput("g")),
            column(2, uiOutput("o"))
        )
    )
)

server <- function(input, output) {
    v <- reactiveValues(b = NULL, i = NULL, n = NULL, g = NULL, o = NULL)
    
    observeEvent(input$card, {
        card <- make_card()
        v$b <- card$B
        v$i <- card$I
        v$n <- card$N
        v$g <- card$G
        v$o <- card$O
    })
    
    output$b <- renderUI({
        tagList(
            p("B", style = "font-size:25px"),
            checkboxInput("b1", v$b[1]),
            checkboxInput("b2", v$b[2]),
            checkboxInput("b3", v$b[3]),
            checkboxInput("b4", v$b[4]),
            checkboxInput("b5", v$b[5])
        )
    })
    
    
    output$i <- renderUI({
        tagList(
            p("I", style = "font-size:25px"),
            checkboxInput("i1", v$i[1]),
            checkboxInput("i2", v$i[2]),
            checkboxInput("i3", v$i[3]),
            checkboxInput("i4", v$i[4]),
            checkboxInput("i5", v$i[5])
        )
    })
    
    
    output$n <- renderUI({
        tagList(
            p("N", style = "font-size:25px"),
            checkboxInput("n1", v$n[1]),
            checkboxInput("n2", v$n[2]),
            checkboxInput("n3", "FREE", TRUE),
            checkboxInput("n4", v$n[4]),
            checkboxInput("n5", v$n[5])
        )
    })
    
    
    output$g <- renderUI({
        tagList(
            p("G", style = "font-size:25px"),
            checkboxInput("g1", v$g[1]),
            checkboxInput("g2", v$g[2]),
            checkboxInput("g3", v$g[3]),
            checkboxInput("g4", v$g[4]),
            checkboxInput("g5", v$g[5])
        )
    })
    
    
    output$o <- renderUI({
        tagList(
            p("O", style = "font-size:25px"),
            checkboxInput("o1", v$o[1]),
            checkboxInput("o2", v$o[2]),
            checkboxInput("o3", v$o[3]),
            checkboxInput("o4", v$o[4]),
            checkboxInput("o5", v$o[5])
        )
    })
    
}

shinyApp(ui = ui, server = server)
Examining Aphex Twin's Eclectic Discography With the Spotify API and Generalized Variance

This week was the week of April 14th, the date that shares the (French) name of Aphex Twin’s most well-known work, “Avril 14th.” I have known about Aphex Twin since maybe middle school or so, but I only first really listened in earnest after hearing “Avril 14th” as the backing track to the poignant ending scene of the black comedy Four Lions. And then, of course, it was sampled in Kanye West’s “Blame Game.”

His discography has always been very hit-or-miss for me. I love the pretty piano, ambient, and down-tempo works. But I’m less a fan of the glitchy, fast-paced tracks; I’m much more into the “Flim” side of his discography than the “Phloam” side.

Aphex Twin strikes me as an artist who has an exceptionally eclectic discography, one where you wouldn’t think would contain both calming, ambient works and anxious, erratic ones.

I wanted to see if this discography was really more varied than comparable artists. The Spotify API allows developers to grab metrics about songs, including three that range from 0 to 1:

  • Danceability: “how suitable a track is for dancing based on a combination of musical elements including tempo, rhythm stability, beat strength, and overall regularity”

  • Energy: “a perceptual measure of intensity and activity. Typically, energetic tracks feel fast, loud, and noisy… attribute include dynamic range, perceived loudness, timbre, onset rate, and general entropy”

  • Valence: “describing the musical positiveness conveyed by a track. Tracks with high valence sound more positive (e.g. happy, cheerful, euphoric), while tracks with low valence sound more negative (e.g. sad, depressed, angry).”

My thinking being that Aphex Twin’s discography would have an exceptionally high variance on these three latent dimensions.

Getting the Data

I used the handy {spotifyr} package to access the Spotify API. I defined a helper function to get artists related to Aphex Twin. This function wrapped around the spotifyr::get_related_artists() function to do the following:

  1. Initialize a list of related artists by getting the 20 artists related most to Aphex Twin (as indicated by listener behavior).

  2. For each of those 20 artists, get their 20 related artists. Bind these data to the initialized data in Step 1. Deduplicate so that no artists are listed twice.

  3. Get the 20 related artists for each of the artists in the remaining dataset resulting after Step 2. Dedupe.

  4. Do it one last time: Get the 20 related artists for each of the artists after Step 3. Dedupe.

The function looks like:

get_related_recursive <- function(id, iter) {
  out <- get_related_artists(id)
  done_iter <- 0
  while (done_iter < iter) {
    tmp <- unique(do.call(bind_rows, lapply(out$id, get_related_artists)))
    out <- unique(bind_rows(out, tmp))
    done_iter <- done_iter + 1
  }
  return(out)
}

Where id is the Spotify artist ID and iter is how many iterations one wants to do after the initial grab of related artists. Full code for getting all of the data can be found at the end of this post. This returned thousands of artists, and I only considered those that had more than 80,000 followers. This resulted in 329 artists. For each artist, I grabbed the audio features for every one of their songs. Three artists didn’t parse, resulting in 326 artists to look at.

Choosing a Metric

My hypothesis is that Aphex Twin has an especially eclectic discography. In statistical terms, we could characterize this as the characteristics of his discography vary more than other artists’. So we want to look at each artist’s discography and see how those variables mentioned above—danceability, energy, and valence—vary. We need a measure of multivariate spread or dispersion.

When looking at just one variable, the answer is straightforward: We can look at the variance for each artist to characterize how much spread there is in the distribution of songs. This would be a good enough metric for our uses, since all songs are measured on the same 0 to 1 scale.

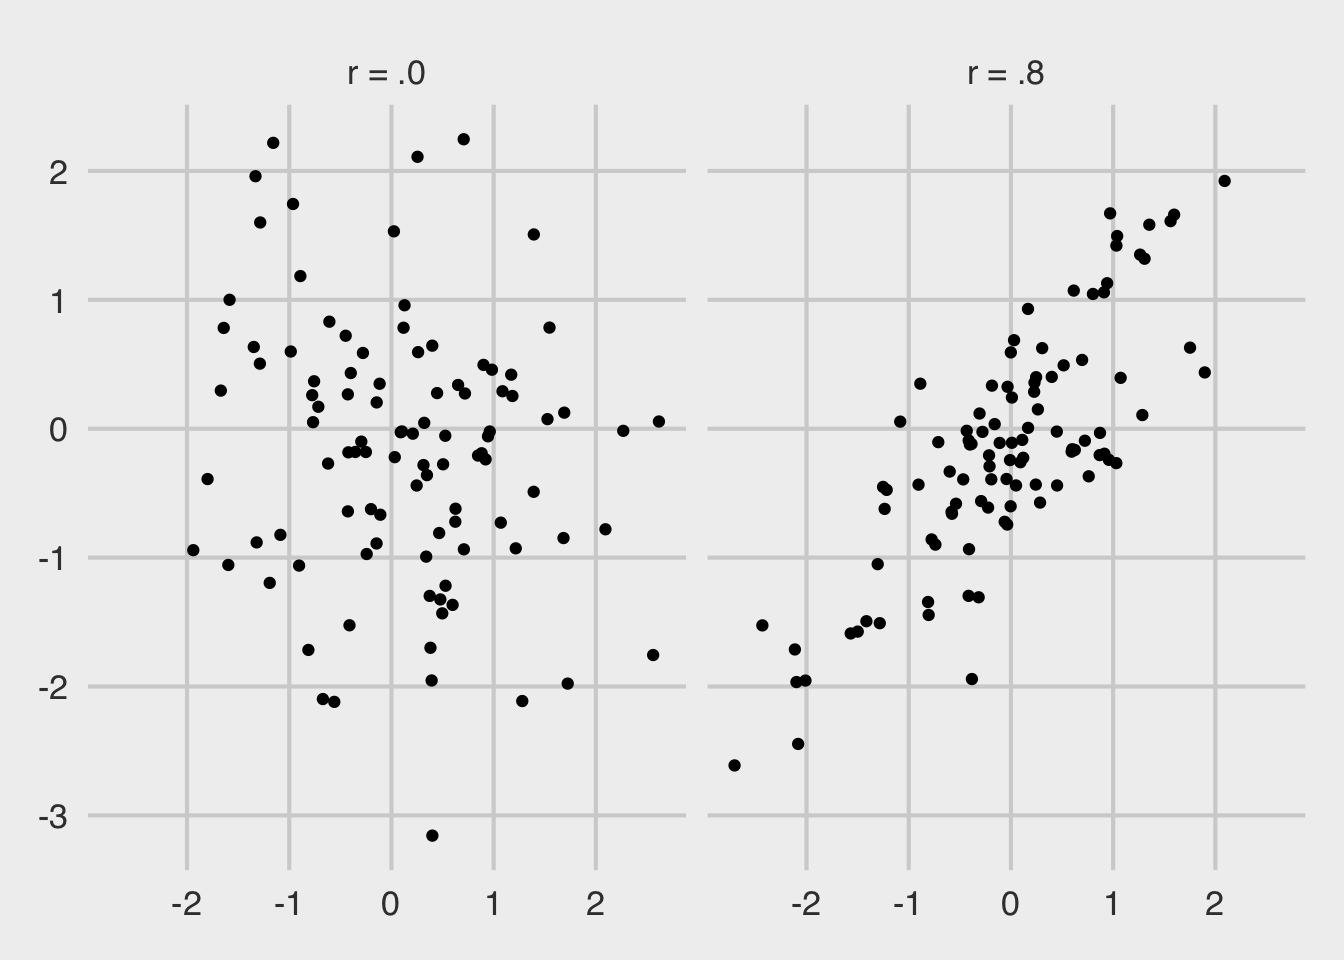
But we want to look at three variables. Summing up the variances of each of the three variables sounds appealing, but there’s a problem: What if two of the variables are highly correlated? Imagine two situations where two variables are plotted against one another, one situation where the variables are completely uncorrelated (left panel) and one where they correlate highly (right panel).

library(tidyverse)
library(mvtnorm)
set.seed(1839)

rmvnorm(100, sigma = matrix(c(1, .8, .8, 1), 2)) %>% 
  rbind(rmvnorm(100, sigma = matrix(c(1, .0, .0, 1), 2))) %>% 
  as.data.frame() %>% 
  mutate(r = rep(c("r = .8", "r = .0"), each = 100)) %>% 
  ggplot(aes(x = V1, y = V2)) +
  geom_point() +
  facet_wrap(~ r) +
  ggthemes::theme_fivethirtyeight(16)
sim-1

We can see that the uncorrelated points take up more space—they are more dispersed. We want a metric that appreciates this. Think of it this way: Since each of the three metrics from Spotify are on a 0 to 1 scale, imagine a cube where each of the sides has a length of 1. In one corner of the box is a point representing a song that is high in energy, valence, and danceability. Another corner has songs where the danceability is high, valence is high, but energy is low. And so on.

I am considering an eclectic catalog of songs to be one that has points all over this cube. The determinant of the covariance matrix can do that for us, which is sometimes known as “generalized variance,” see Wilks (1932) and Sen Gupta (2006).

Analysis

A highly-eclectic, varied discography of songs is thus one with a large generalized variance. For each of the artists, I got the generalized variance across all of their songs on Spotify, using the following code:

dat <- read_csv("aphex_twin_related_features.csv")

gen_var <- sapply(unique(dat$artist_name), function(x) {
  dat %>% 
    filter(artist_name == x) %>% 
    select(danceability, energy, valence) %>% 
    cov() %>% 
    det()
})

And we can plot the top 30 artists, similar-ish to Aphex Twin, that have the most generalized variance.

tibble(artist_name = unique(dat$artist_name), gen_var) %>%
  top_n(30, gen_var) %>% 
  arrange(gen_var) %>% 
  mutate(artist_name = factor(artist_name, artist_name)) %>% 
  ggplot(aes(x = artist_name, y = gen_var)) +
  geom_bar(stat = "identity", fill = "#4B0082") +
  coord_flip() +
  labs(title = "Most Varied Discographies", 
       subtitle = "Of popular artists similar to Aphex Twin",
       x = "Artist", y = "Generalized Variance", 
       caption = "@markhw_") +
  ggthemes::theme_fivethirtyeight() +
  theme(axis.title = element_text())
plot-1.png

Aphex Twin, by a wide margin, has the most varied Spotify discography in terms of danceability, energy, and valence. This is of a sample of popular, comparable artists—those that people who listen to Aphex Twin also listen to. Some other great artists are on here, as well: Boards of Canada, Four Tet, Thom Yorke, RJD2, Broken Social Scene, Flying Lotus.

You can see all the data and code for this post by going to my GitHub.

Code for Grabbing Data

# get data ---------------------------------------------------------------------
library(tidyverse)
library(spotifyr)

get_related_recursive <- function(id, iter) {
  out <- get_related_artists(id)
  done_iter <- 0
  while (done_iter < iter) {
    tmp <- unique(do.call(bind_rows, lapply(out$id, get_related_artists)))
    out <- unique(bind_rows(out, tmp))
    done_iter <- done_iter + 1
  }
  return(out)
}

dat <- get_related_recursive("6kBDZFXuLrZgHnvmPu9NsG", 3)

dat <- dat %>% 
  filter(followers.total >= 80000) %>% 
  select_if(function(x) !is.list(x))

write_csv(dat, "aphex_twin_related.csv")

dat2 <- lapply(dat$name, function(x) {
  cat(x, "\n")
  tryCatch(
    get_artist_audio_features(x),
    error = function(x) return(NA)
  )
})

dat2 <- lapply(dat2, function(x) {
  if (is.data.frame(x)) {
    x %>% 
      select_if(function(x) !is.list(x))
  } else {
    NA
  }
})

dat2 <- dat2[!is.na(dat2)] %>% # 3 artists failed to parse
  do.call(bind_rows, .)

write_csv(dat2, "aphex_twin_related_features.csv")

A Function for Calculating Tidy Summaries of Multiple t-tests

The t-test is one of the most often used in psychology and other social sciences. In APA format, researchers are told to report the means and standard deviations of both conditions; the t-statistic, its degrees of freedom, and its p-value; and an effect size with confidence interval (generally Cohen’s d and 95%).

Researchers frequently conduct randomized experiments with not just one dependent variable, but many. And they may want to make sure that other variables, such as age, do not differ by condition.

The following function will return all the necessary information from t-tests. I don’t have it in a package yet (and don’t know where I’d put it—yet. Drop me a line if you think it fits in an existing package; I would be happy to include it in an existing package). So you’ll have to copy, paste, and run the following into your script to use it.

t_table <- function(data, dvs, iv, var_equal = TRUE, p_adj = "none") {
  
  if (!inherits(data, "data.frame")) {
    stop("data must be a data.frame")
  }
  
  if (!all(c(dvs, iv) %in% names(data))) {
    stop("at least one column given in dvs and iv are not in the data")
  }
  
  if (!all(sapply(data[, dvs], is.numeric))) {
    stop("all dvs must be numeric")
  }
  
  if (length(unique(na.omit(data[[iv]]))) != 2) {
    stop("independent variable must only have two unique values")
  }
  
  out <- lapply(dvs, function(x) {
    
    tres <- t.test(data[[x]] ~ data[[iv]], var.equal = var_equal)
    
    mns <- tapply(data[[x]], data[[iv]], mean, na.rm = TRUE)
    names(mns) <- paste0(names(mns), "_m")
    
    sds <- tapply(data[[x]], data[[iv]], sd, na.rm = TRUE)
    names(sds) <- paste0(names(sds), "_sd")
    
    es <- MBESS::ci.smd(ncp = tres$statistic, 
                        n.1 = table(data[[iv]])[[1]], 
                        n.2 = table(data[[iv]])[[2]])
    
    c(
      c(mns[1], sds[1], mns[2], sds[2]),
      tres$statistic,
      tres$parameter,
      p = tres$p.value,
      d = unname(es$smd),
      d_lb = es$Lower,
      d_ub = es$Upper
    )
  })
  
  out <- as.data.frame(do.call(rbind, out))
  out <- cbind(variable = dvs, out)
  names(out) <- gsub("[^0-9A-Za-z_]", "", names(out))
  
  out$p <- p.adjust(out$p, p_adj)
  
  return(out)
}

The first argument specifies a data.frame where the data reside, a string vector of the names of the dependent variables, a string indicating the independent variable, a logical value on whether or not to assume variances are equal across conditions (defaults to TRUE for a classic t-test), and a string indicating what p-value adjustments to do. See ?p.adjust.methods for more information on which methods are available to use. This defaults to no adjustment. (The function with full documentation in {roxygen2} format can be found at my GitHub.) Note that this function depends on the {MBESS} package, so make sure to have that installed first (but you don’t need to call library on it).

What does it look like in action? Let’s imagine a ctl and exp condition, with the dependent variables of y1, y2, etc., through y10, and a sample size of 128. I simulate that data below, where y1 and y2 have significant effects with a Cohen’s d = 0.5 and 0.8, respectively.

set.seed(1839)
cond <- rep(c("ctl", "exp"), each = 64)
y1 <- rnorm(128, ifelse(cond == "ctl", 0, .5))
y2 <- rnorm(128, ifelse(cond == "ctl", 0, .8))
dat <- as.data.frame(lapply(1:8, function(zzz) rnorm(128)))
dat <- cbind(cond, y1, y2, dat)
names(dat)[4:11] <- paste0("y", 3:10)
dat[1:5, 1:5]
##   cond         y1         y2          y3         y4
## 1  ctl  1.0127014 -1.6556888  2.61696223  0.3817117
## 2  ctl -0.6845605  0.8893057  0.05602809 -1.6996460
## 3  ctl  0.3492607 -0.4439924  0.33997464  0.8473431
## 4  ctl -1.6245010  1.2612491 -0.99240679 -0.2083059
## 5  ctl -0.5162476  0.2012927 -0.96291759 -0.2948407

We can then feed the necessary information to the t_table function. Note that, instead of typing out all the y1 through y10 columns, I use the paste0 function to generate them in less code. I don’t do any rounding for you inside of the function, but for the sake of presentation, I round to 2 decimal points here.

result <- t_table(dat, paste0("y", 1:10), "cond")
result[-1] <- lapply(result[-1], round, 2)
result
##    variable ctl_m ctl_sd exp_m exp_sd     t  df    p     d  d_lb  d_ub
## 1        y1 -0.07   0.96  0.26   0.90 -2.04 126 0.04 -0.36 -0.71 -0.01
## 2        y2  0.05   1.02  0.82   0.91 -4.48 126 0.00 -0.79 -1.15 -0.43
## 3        y3  0.07   1.11 -0.07   0.99  0.76 126 0.45  0.13 -0.21  0.48
## 4        y4  0.00   1.04 -0.27   1.05  1.44 126 0.15  0.26 -0.09  0.60
## 5        y5  0.06   0.91 -0.28   1.08  1.93 126 0.06  0.34 -0.01  0.69
## 6        y6  0.05   1.03  0.06   1.09 -0.08 126 0.94 -0.01 -0.36  0.33
## 7        y7 -0.01   0.96 -0.06   1.08  0.30 126 0.77  0.05 -0.29  0.40
## 8        y8 -0.08   0.99 -0.18   0.98  0.56 126 0.58  0.10 -0.25  0.45
## 9        y9  0.37   0.93 -0.18   1.05  3.13 126 0.00  0.55  0.20  0.91
## 10      y10 -0.11   0.85 -0.21   0.94  0.59 126 0.56  0.10 -0.24  0.45

Note that we got a few false positives here. Which leads to using p-value adjustments, if you wish. Let’s now say I use the Holm adjustment.

result2 <- t_table(dat, paste0("y", 1:10), "cond", p_adj = "holm")
result2[-1] <- lapply(result2[-1], round, 2)
result2
##    variable ctl_m ctl_sd exp_m exp_sd     t  df    p     d  d_lb  d_ub
## 1        y1 -0.07   0.96  0.26   0.90 -2.04 126 0.35 -0.36 -0.71 -0.01
## 2        y2  0.05   1.02  0.82   0.91 -4.48 126 0.00 -0.79 -1.15 -0.43
## 3        y3  0.07   1.11 -0.07   0.99  0.76 126 1.00  0.13 -0.21  0.48
## 4        y4  0.00   1.04 -0.27   1.05  1.44 126 0.91  0.26 -0.09  0.60
## 5        y5  0.06   0.91 -0.28   1.08  1.93 126 0.39  0.34 -0.01  0.69
## 6        y6  0.05   1.03  0.06   1.09 -0.08 126 1.00 -0.01 -0.36  0.33
## 7        y7 -0.01   0.96 -0.06   1.08  0.30 126 1.00  0.05 -0.29  0.40
## 8        y8 -0.08   0.99 -0.18   0.98  0.56 126 1.00  0.10 -0.25  0.45
## 9        y9  0.37   0.93 -0.18   1.05  3.13 126 0.02  0.55  0.20  0.91
## 10      y10 -0.11   0.85 -0.21   0.94  0.59 126 1.00  0.10 -0.24  0.45

But note that the width of the confidence intervals are not adjusted here.